
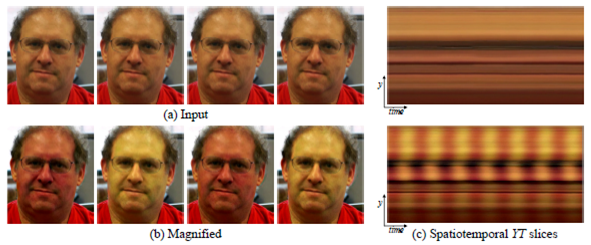
Eulerian video magnification (EVM) is very new technique that enables amplification and thus revealing subtle changes and movements on standard quality videos. It reveals temporal variations in videos that are difficult or impossible to see with naked eye. Since human visual system has limited spatio-temporal sensitivity this could serve as a microscope for videos.
Basic idea and working principle can be seen on picture below [1].
More about it can be found here:
http://people.csail.mit.edu/mrub/vidmag/
https://www.youtube.com/watch?v=ONZcjs1Pjmk
or on this TED https://www.youtube.com/watch?v=fHfhorJnAEI&spfreload=10
Idea of the project
Idea of this project was to evaluate if Eulerian video magnification applied to video recordings of palpation sites of human could be used for contactless heart rate(HR) and pulse transit time (PTT) assessment.
Today still most of the methods to measure heart rate and pulse transit time need contact with skin and some are even invasive. From this reason simple method which is contactless and doesn’t require any special equipment except camera for recording and computer for processing would be of large significance.
EVM principle
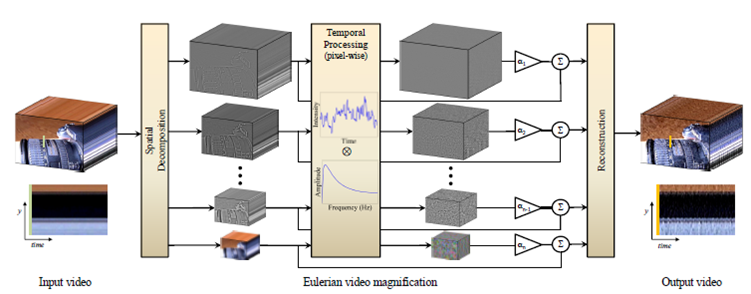
In EVM spatio-temporal processing is used to emphasize subtle temporal changes in video. Multiscale analysis is started by computing a full Laplacian pyramid from input video sequence. Levels of Laplacian pyramid can be also called spatial frequency bands. Temporal processing is performed on each spatial band. Values of each pixel in time are observed and a bandpass filter is used to extract the frequency band of interest. The temporal filtering is defined by the type of changes (motion, vibrations etc.) that we want to extract. The same filtering is applied to all spatial levels and to all pixels within each level. Extracted bandpass signal is then multiplied by magnification factor α. In the end magnified signal is added to the original signal and spatial pyramid is collapsed in order to obtain the final output video. All the steps are visually shown on picture below [1].
Measurement setup
Measurement setup consisted of ECG measuring setup, pressure measuring setup, photoplethysmogram (PPG) setup and camera. It was all done at Technical University of Vienna using “Biopac systems” MP36R four-channel data acquisition system. Software used to visualize and log the data was “Biopac Student Lab System” while processing and calculation of recorded signals and video was done using “Matlab”. These measurements were done simultaneously while video of palpation site was recorded. Video was recorded using “GoPro Here4 Silver” camera using 120 fps and 720×680 px resolution and “normal” field of view. Lightning conditions were good but no extra equipment was used except small table lamp sometimes. The goal was to have simplest and cheapest equipment as possible so that patient could use it eventually at home independently.
Measurement procedure
Measurements were done in a way that first subject was breathing normally for approx. 30 seconds, and then deep breathing was done so that subject could start apnea (breath holding). Apnea lasted approx. 40-60 seconds, and after it subject was recorded for next approx. 20 seconds.
This procedure was chosen because during it blood pressure changes significantly. At the beginning pressure is at some normal value for the resting condition. During breath holding pressure starts to drop and reaches minimal value, and then starts to rise and reaches maximal value. This way at least three different time and pressure ranges can be chosen in order to compare PTT calculated from video and EVM and measured pressure.
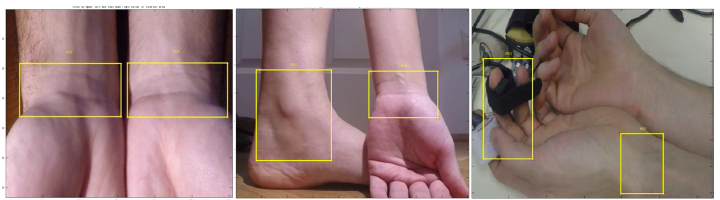
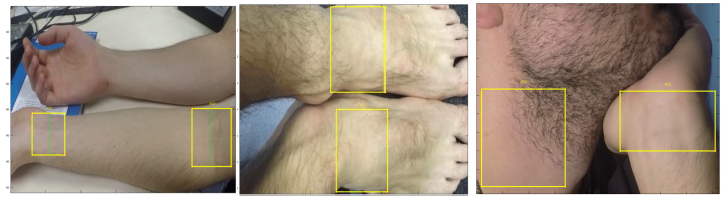
Different palpation sites were used in order to compare results and find the best palpation sites for HR measurement and best pair of palpation sites for blood pressure assessment. On following pictures frames from videos where different palpation pairs were used are shown. Even between two wrists or two toes there should be PTT difference because heart is moved a little to the left side of the chest.
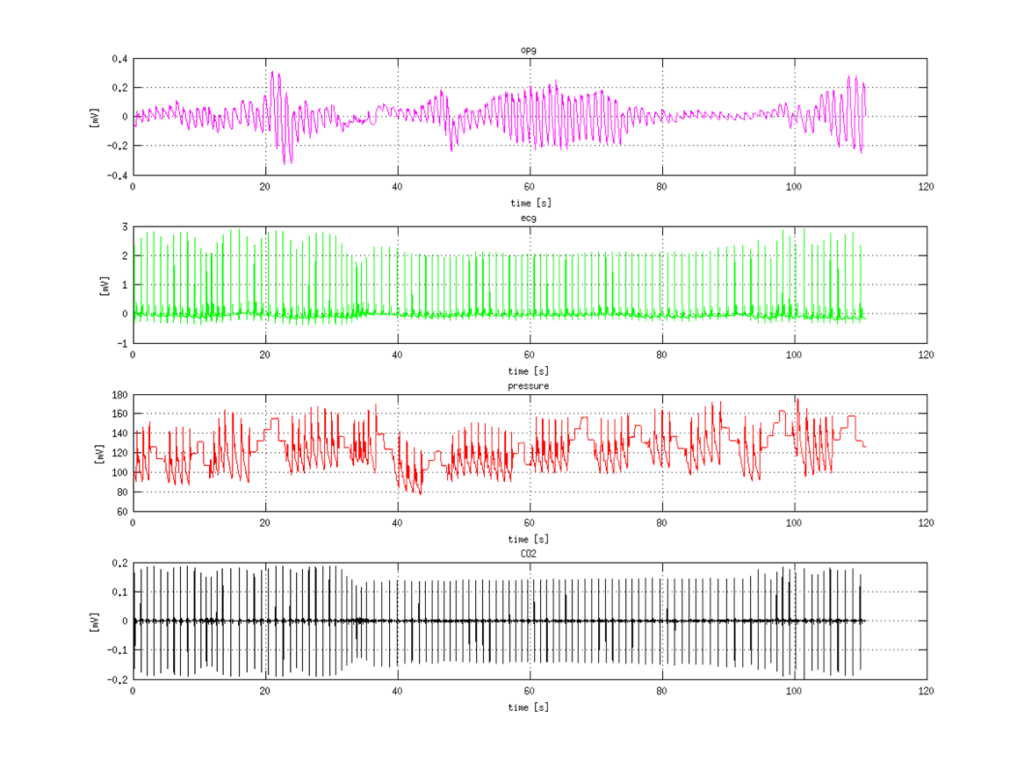
 Example of recorded signals is shown on next picture. First signal is photoplethysmogram (PPG), then electrocardiogram (ECG) and third measured is pressure. Fourth signal is CO2 consumption which was not measured but computed, and is not important for the project.
HR assesment
There are several sites on the body where a pulse can be measured. All arteries have a pulse, but it is easier to palpate the pulse at locations where artery is near the surface of the skin and when there is firm tissue (such as a bone) beneath the artery. The three most common sites are the radial (wrist), carotid (throat), and brachial (inside of elbow).
Basic steps in order to extract heart rate from bare video are:
- selection region of interest (ROI) in order to reduce computational efforts and reduce error probabilities
- computing EVM of the ROI
- calculating average FFT of amplified ROI
Calculating average FFT was not as easy as it seems. There was a question if it is better to calculate average FFT or FFT of average. Average FFT showed to be more reliable and robust.
The second thing that needed testing was which pixels of ROI are actually the interesting ones. This happens because the ROI is usually general area around palpation site, not really area of vessel with amplified movements, because it’s hard and unrealistic to expect that person can select exactly place with larger vessel movements. There were few things tried: using all pixels in ROI, using only middle line and using only pixels with largest amplitude values
On the image below dependence of HR assessment depending on the ROI selection is shown. 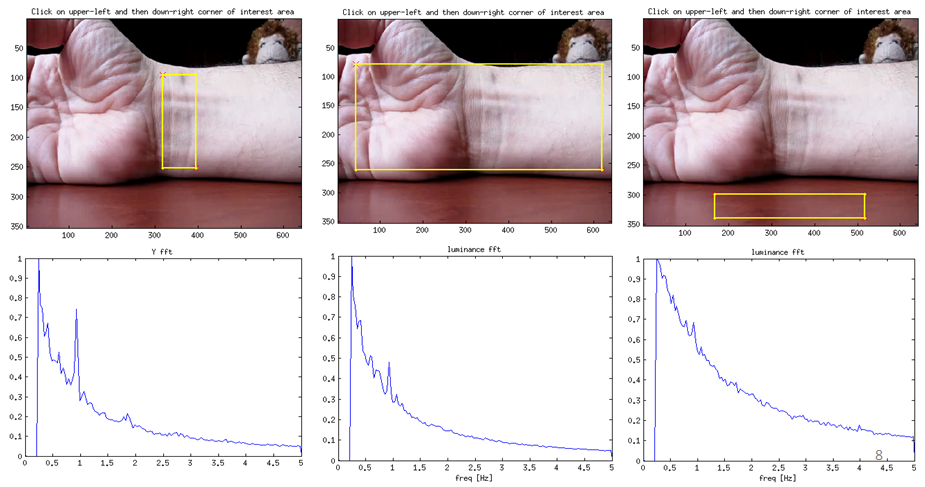
In order to really compare HR calculated using EVM method from video and real HR measured with ECG, HR was calculated from ECG. HR was calculated in “Matlab” using function that recognizes QRS peaks. When peaks were recognizes program calculates time interval between two neighboring peaks 𝑇𝑝𝑝 and calculates heart rate 𝑓ℎ𝑟 as 1/𝑇𝑝𝑝 for each two neighboring QRS peaks. Example of HR (𝑓ℎ𝑟) calculated and plotted in time is on picture below.
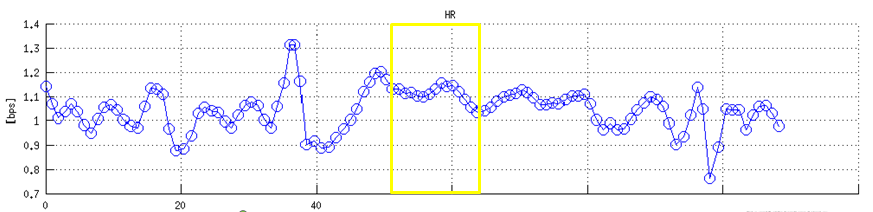
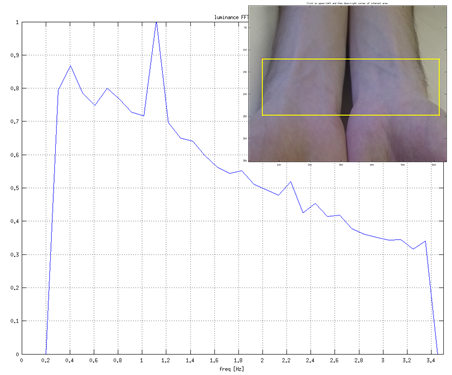
On real HR signal time range (10s) with relatively constant HR was selected (as shown on picture above). Video cut-out of 10s with time stamps where HR was constant was used only. ROI was selected and amplified, pixel values in time evaluated and FFT from this 10s cut-out was calculated. If video was shorter it would be easier to find constant HR value, but resolution of FFT would not enable to precisely determine frequency of real peak. This way 10s time was compromise between resolution and precision of FFT calculation and possibility to find HR region with relatively constant value.
The calculated HR (corresponding FFT) is shown on a figure below. It can be seen that HR is determined precisely. This was tested and confirmed on more moments (cut outs) of HR signal.
Pulse transit time assessment
The velocity at which the arterial pulse propagates is called the “pulse wave velocity” (PWV). PWV is used as a measure of arterial stiffness. It is easy to measure it invasively and non-invasively in humans and is highly reproducible. It’s important because it has a strong correlation with cardiovascular events and all-cause mortality.
The equation that directly relates PWV and artery wall stiffness is called Moens-Korteweg equation. PWV increases with pressure because arterial compliance decreases with increasing pressure (due to curvilinear relationship between arterial pressure and volume). Volume increases with increasing pressure because artery dilates which directly increases PWV. PWV approximately increases with a rate of 1m/s per 100mmHg pressure.
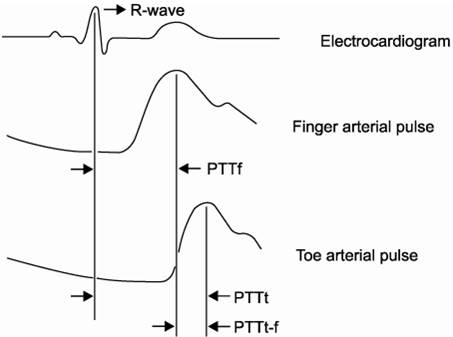
Pulse transit time is generally time difference of pulse wave signal coming to two different places in body. If the first place is heart than it can also be called PAT. In picture below PTT between three different places are shown; PTTf – PTT from heart to finger, PTTt – PTT from heart to toe and PTTt-f – PTT from finger to toe.
Since PTT is directly connected to pulse wave velocity (PWV) it is suitable as an indirect measure of blood pressure change. Exactly this fact will be used to evaluate if this method works, and if it can be used to measure blood pressure. Of course that calibration would be needed at the beginning, since PWV and PTT are related to pressure change and not to absolute value of pressure.
Idea was to record two palpation places at the same time with one camera, extract pulse signals on both of them and measure time shift between them. Time shift is related to PWV and PWV is related to blood pressure.
First, person selects two regions of interest (ROIs). First selected (ROI1) is the one that is further from the heart and the second one is the one closer to the heart (ROI2). Two videos are made, one for each ROI because in case of making EVM with original video computation was time and memory restricted. Newly composed videos are loaded and each is amplified separately but with same EVM parameters.
Average signal in time was calculated for both of the videos. Next step was filtering these time signals with frequency range of interest. Instead of first-order IIR filter suggested in [1] for motion amplification ideal bandpass filter was used. The problem with IIR filter was that borders were too broad and actually it was not clear which frequencies are contained in the filtered signal and which are not, and that made further calculation worse. Frequency band that was most often used was [0.75, 1.25]Hz, but in future the idea is to find HR with FFT as previously described and then filter with range [HR-25%HR,HR+25%HR]. This 25% width could be altered depending on the quality of results.
The last step is to calculate time shift between time signals of two ROIs. This is done calculating correlation between two signals. PTT is time value where correlation is maximal. PTT has to be positive, because of agreement which one is ROI1 and which ROI2 during selection.
An example of video frame with two ROI selection, FFTs and average signals in time for both ROIs and calculated correlation are shown on figure below.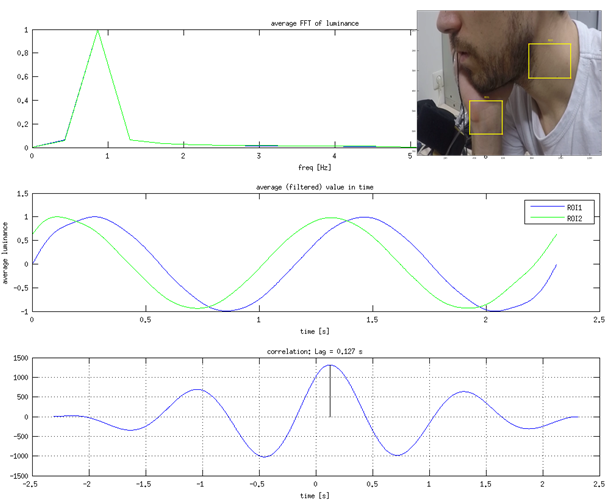
There is still lot of work with PTT assessment and relating it to blood pressure, but preliminary experiments were done. First experiment was to measure PTT for different pairs of palpation places. For each pair average PTT for ~10 measurements was done and approximated difference of distances of palpation places from heart was measured. Measurements were different selections of ROIs on the same video. Idea was to compare calculated PWV for all palpation pairs. First results are shown in table below.
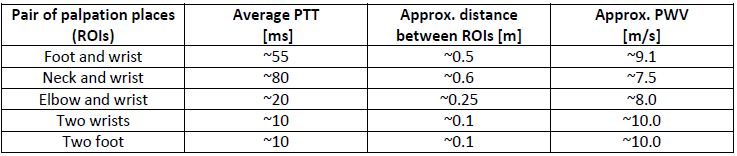
Even though approx. PWV are not the same, they are relatively similar and fit into the frame of possible PWV values for young person. More experiments and more thorough evaluation are needed. Plan is to test with even more different selections of ROIs, to make different videos of the same subject and also to use more different subjects.
Blood pressure assessment
Absolute value of PTT or calculated value of PWV doesn’t tell much actually, because it depends on many individual parameters for each person. Also most of these parameters are not even easily measurable. PTT and PWV are related with blood pressure, but PWV and PTT could not be used to determine absolute value of blood pressure, but to detect changes in pressure, which is also very useful indicator. Since only change in pressure could be determined, calibration would be needed for each patient in order to know some starting pressure values.
In order to test if there is correct correlation between PTT (and PWT) measured with EVM method and real pressure differences a measurement with voluntary apnea is used. Measurement was processed in a way that from pressure recording three regions were selected; before apnea where pressure was of an average value, during apnea where pressure reached minimal value and after apnea at the moment when pressure reached maximal value as shown in picture below. Each region was 5 seconds long so that videos would be enough long to precisely determine correlation between signals. Idea was to plot PTT vs pressure.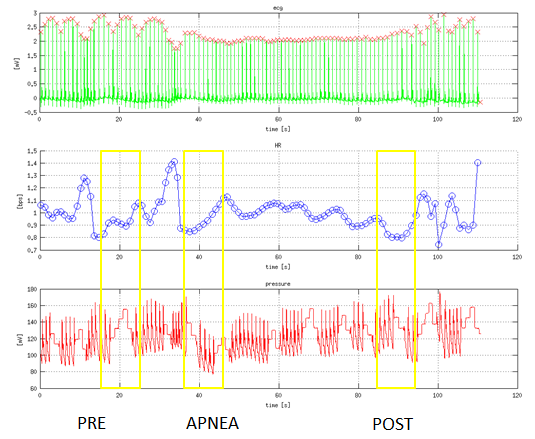
If blood pressure is high, arterial walls are tenser and more firm which causes the pulse wave to travel faster. This means that PWV is larger and PTT is shorter. From this follow some basic expectations as written in table below. Simple illustration is also shown on a picture below.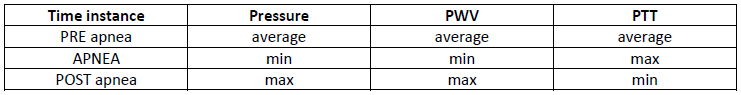
Current measurements were done using different palpation pairs from one video of only one person. At the moment calculated PTT from measurements doesn’t follow the expectations from table above. PTT times are way too large, meaning that PWV calculated from them are not possible. There are few suspicions why this happened. One of them is that video recordings were not good, because even when amplified, motion is barely visible (which is not typical after amplification). Possible is that regions were not zoomed enough, that lightning conditions were not enough good, and that hand or neck were not enough still during recording and that maybe some holders should be used. It is possible that movement of hand or neck is extracted and analyzed instead of vessel vibration. More probable is that parameters of EVM amplification were not good enough. In EVM amplification algorithm parameters are amplification, spatial wavelength, frequency borders and levels of Laplacian pyramid. It was assumed that those parameters can be the same for all videos and all palpation pairs but maybe this is not true. All these things need to be further investigated.
Acknowledgement
This project was done during semester at Erasmus exchange at Technical University of Vienna. Many thanks goes to mentors F.T. and E.K. without whose support this wouldn’t be done.
Literature
[1.] H. Wu, M. Rubinstein, E. Shih, J. Guttag, F. Durand, W. Freeman: Eulerian Video Magnification for Revealing Subtle Changes in the World
[2.] Jeong, I. Cheol, J. Finkelstein: Introducing Contactless Blood Pressure Assessment Using a High Speed Video Camera
[3.] EJ. Kim, CG. Park, JS. Park, SY. Suh, CU. Choi, JW. Kim, SH. Kim, HE. Lim, SW. Rha, HS. Seo, DJ. Oh: Relationship between blood pressure parameters and pulse wave velocity in normotensive and hypertensive subjects: invasive study
[4.] E. Kaniusas: Biomedical sensors and signals I, Springer 2012.
[5.] P. Boloto Chambino: Android-based implementation of Eulerian Video Magnification for vital signs monitoring
[6.] M. Estrada, A. Stowers: Amplification of Heart Rate in Multi-Subject Videos
[7.] M.A.Elgharib, M. Hefeeda, F. Durand, W.T.Freeman: Video Magnification in Presence of Large Motions